

Like (hopefully) all of us I've been busy with upgrades since last week. Specifically last Wednesday night after hours PHP rose from 7.x (shame on me) to 8.4, then over the weekend Debian graduated from 11 and/or 12 (previous upgrade attempt from 11 to 12 was partially incomplete), Freeswitch jumped to 1.11, and FusionPBX from 5.5 to 5.6. Although Postgresql 17 was installed seems it's empty and idle with 13 still being used, found good member documentation to use over the weekend to move data over and point to 17.
After the OS and Freeswitch upgrades this past weekend CPU utilization is elevated (ruled out PHP/FusionPBX being the culprit, Freeswitch appears to be the hungry one). Wondering if anyone else has experienced the same and what they may have done to resolve. May have lost previous tuning/optimizations during the upgrade so I'll certainly be scouting the public and member documentation over the weekend, but figured can't hurt to ask here after Super Intelligence let me down, perhaps a human may know of a default value changing which could explain it.
Dashboard panels clockwise from top left are histograms showing Registration count, Idle CPU, Disk use percentage, call setups per second at the moment of data collection, monitored systemctl service, scrape targets, bridged calls, and failed calls. The dashboards from left to right are 12 hour windows from: 2 Wednesdays ago (old everything), last Wednesday (web UI was 'offline'), last Thursday (PHP upgraded to 8.4), and finally this Wednesday (everything at latestish).
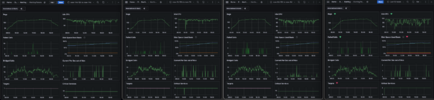
In case of curiosity the UI is grafana, datasource prometheus, and metrics from prometheus (targets), node exporter (disk space, critical services) and freeswitch exporter (the rest). Moved the UI and datasource to a dedicated host after a few self inflicted incidents when everything was running on the same tiny VM as Fusion/Freeswitch.
After the OS and Freeswitch upgrades this past weekend CPU utilization is elevated (ruled out PHP/FusionPBX being the culprit, Freeswitch appears to be the hungry one). Wondering if anyone else has experienced the same and what they may have done to resolve. May have lost previous tuning/optimizations during the upgrade so I'll certainly be scouting the public and member documentation over the weekend, but figured can't hurt to ask here after Super Intelligence let me down, perhaps a human may know of a default value changing which could explain it.
Dashboard panels clockwise from top left are histograms showing Registration count, Idle CPU, Disk use percentage, call setups per second at the moment of data collection, monitored systemctl service, scrape targets, bridged calls, and failed calls. The dashboards from left to right are 12 hour windows from: 2 Wednesdays ago (old everything), last Wednesday (web UI was 'offline'), last Thursday (PHP upgraded to 8.4), and finally this Wednesday (everything at latestish).
In case of curiosity the UI is grafana, datasource prometheus, and metrics from prometheus (targets), node exporter (disk space, critical services) and freeswitch exporter (the rest). Moved the UI and datasource to a dedicated host after a few self inflicted incidents when everything was running on the same tiny VM as Fusion/Freeswitch.
Last edited: