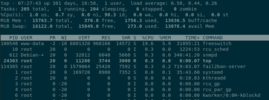
Try to find out what process is using the CPU, and if the usage is being reported correctly. The top utility is a good place to start. Top will normally show you an aggregation of CPU usage as shown below:

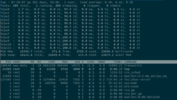
But if you press the 1 key while it is running, it will show you each CPU individually:

I can never remember what the mnemonics mean, so here is a reminder:
- us: % of CPU used in user space (running user-spawned processes).
- sy: % of CPU used in kernel space (running system processes).
- ni: % CPU time used running processes with a user-defined priority (a specified nice value).
- id: % CPU time used in the idle process.
- wa: % CPU time used waiting on I/O from hardware. Example: waiting for a hard drive to finish reading data.
- hi: % CPU time used processing hardware interrupts. Example: the network card (or any piece of hardware) interrupting the CPU to notify it that new data has arrived.
- si: % CPU time used processing software interrupts. Example: a high priority service interrupting the CPU.
- st: % CPU time used that was stolen from a virtual machine. The kernel needed to “steal” resources from a virtual machine in order to process the physical machine’s workload.
You can check that all your CPU cores have been properly recognised by the kernel using:
cat /proc/cpuinfo
Other utilities include, htop, systat, mpstat


